Intel Core i9-13900K and i5-13600K Review: Raptor Lake Brings More Bite
by Gavin Bonshor on October 20, 2022 9:00 AM ESTRaptor Lake In Detail: Raptor Cove P-Cores, More Efficiency Cores
When it comes to architecturally dissecting the differences between Intel’s Alder Lake and Raptor Lake processors, both are based on a similar process. Intel’s 12th Gen Core (Alder Lake) series and the latest 13th Gen Core (Raptor Lake) are based on its Intel 7 manufacturing processor, although this isn’t to be confused with 7 nm, as Intel 7 is a 10 nm process node. This means that Raptor Lake isn't a new core so to speak, especially not a redesign of its existing 10ESF core, but more augmentation. Intel has opted for improvements to its underlying memory and cache structures.
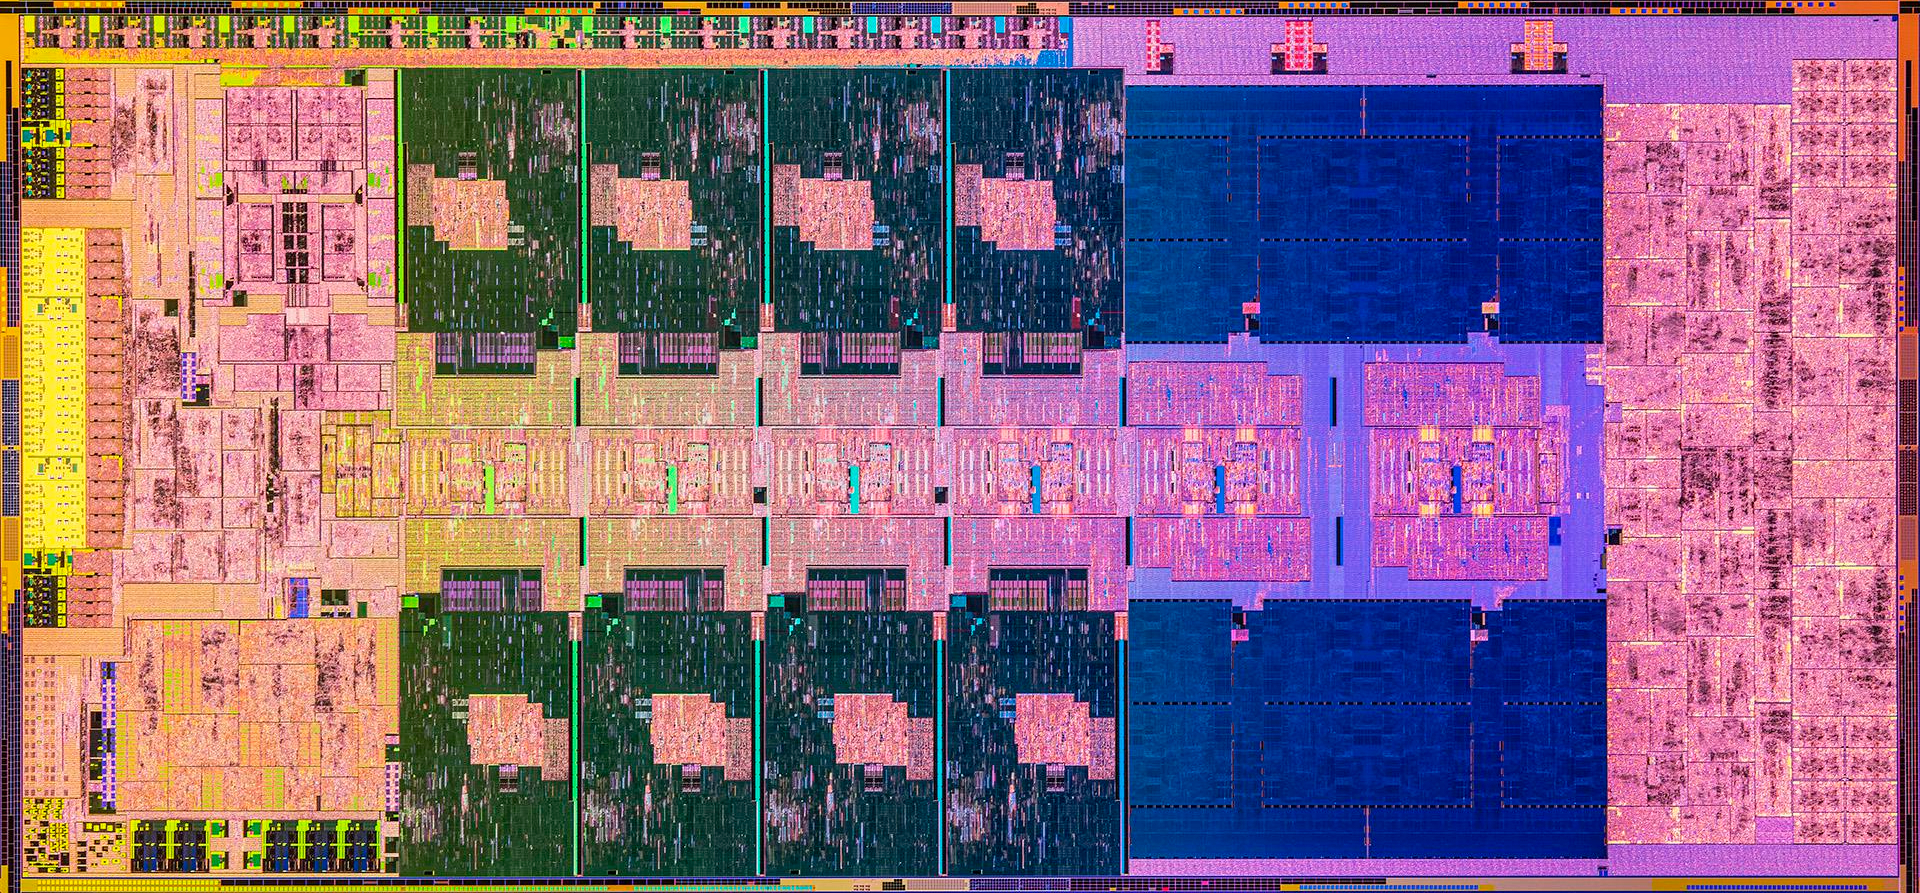
Intel Raptor Lake Core die image (Core i9-13900K)
The new Raptor Cove performance (P) cores replace the previous Golden Cove variants, with Intel specifying that Raptor Cove is based on an ‘enhanced’ version of its Intel 7 process using its 3rd generation of SuperFin transistor. With this newly optimized process combined with a better overall VF curve over the last age, Intel hopes to leverage the benefit from a higher frequency without increasing power levels too much.
Focusing on changes to the cache, the 13th Gen Core series has more L2 cache. For the new Raptor Cove core, Intel has added more L2 cache when compared to Alder Lake, with 1.6x more with 2 Mb per P-core. The levels of L2 cache assigned to each array of E-cores now equates to 4 Mb; up from 2 Mb. This means Intel has improved the L2 cache on both core types. For the L3 cache, Intel hasn't made any strides and has left things unchanged.
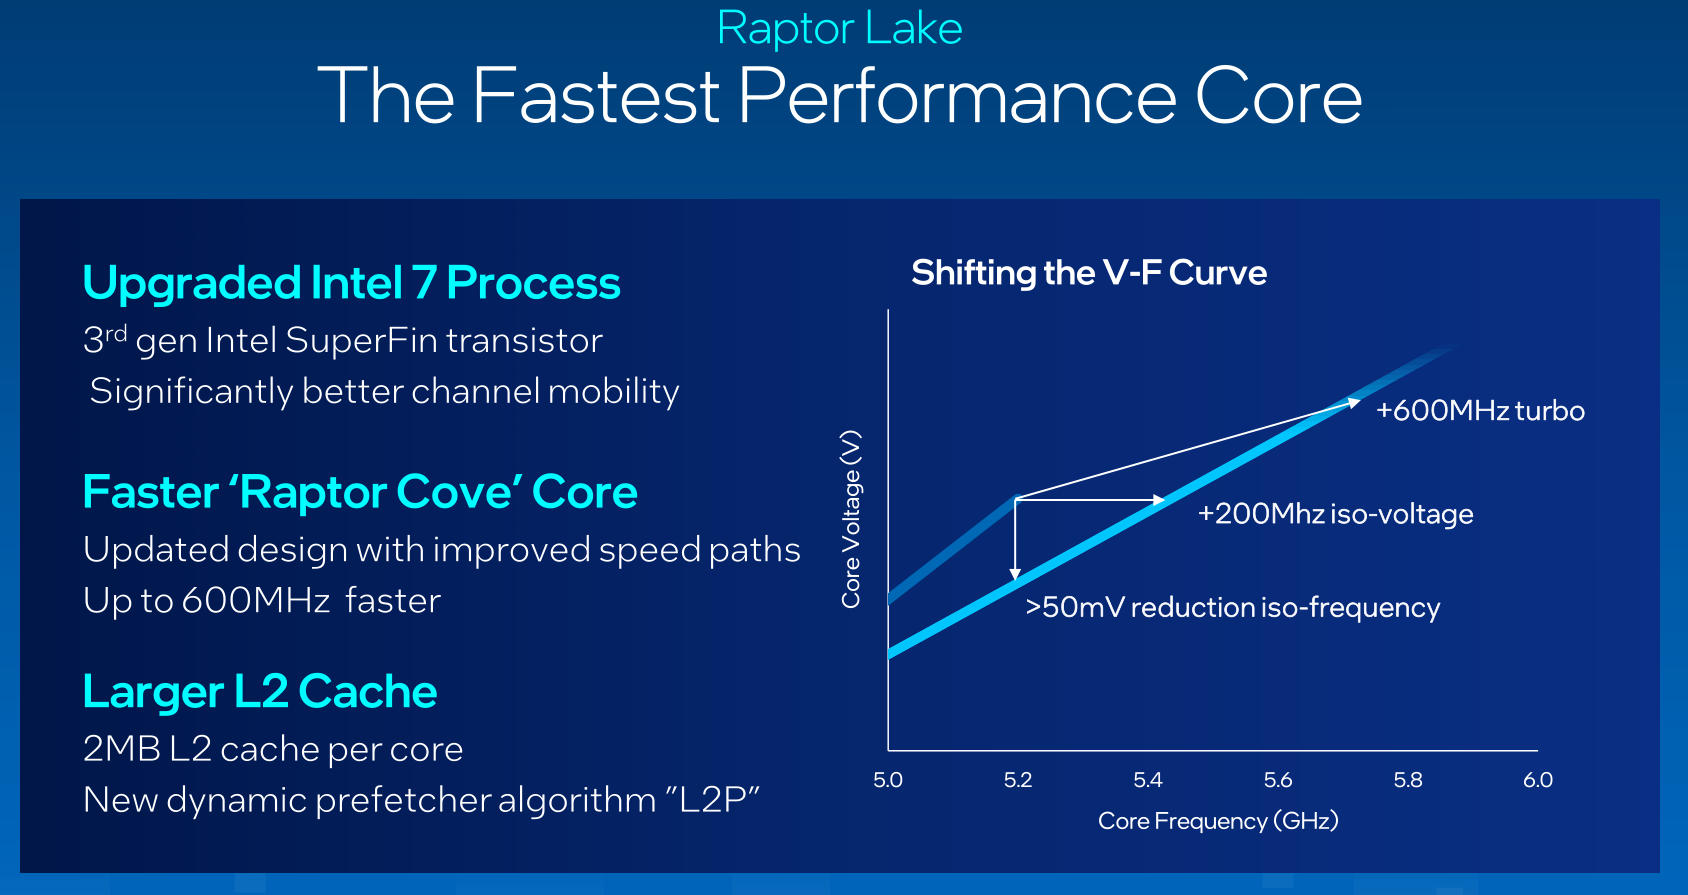
Adjusting to the Voltage Frequency (VF) cure has allowed Intel to squeeze out even more gains about frequency versus voltage. In the case of Raptor Lake, Intel has managed to increase the peak P-Core frequency by a significant amount, up to 1 GHz in some cases. An example is the Core i9-13900K which has a maximum turbo frequency of up to 5.8 GHz; this equates to just over 11.5% over the Core i9-12900K. As per the released V/F curve optimizations, Intel has managed to eke out 200 MHz at ISO-Voltage, with a reduction of 50 mV at ISO frequency.
One thing to highlight about Intel’s 13th Gen Core series processors is the discrepancy between the base TDP, which for its entire launched stack (as of 10/20) is 125 W. The turbo or PL2 values are the same for the Core i9 and Core i7 models which are set at 253 W. This is an increase of 12 W from the corresponding 12th Gen Core i9 chips (241 W), and up by 63 W on the Core i5 series like for like. With the element of adding double the amount of E-cores, even with a more efficient V/F curve, there had to be tradeoffs when it came to power.
Raptor Lake and E-Cores: Same Gracemont Cores, Just More of Them
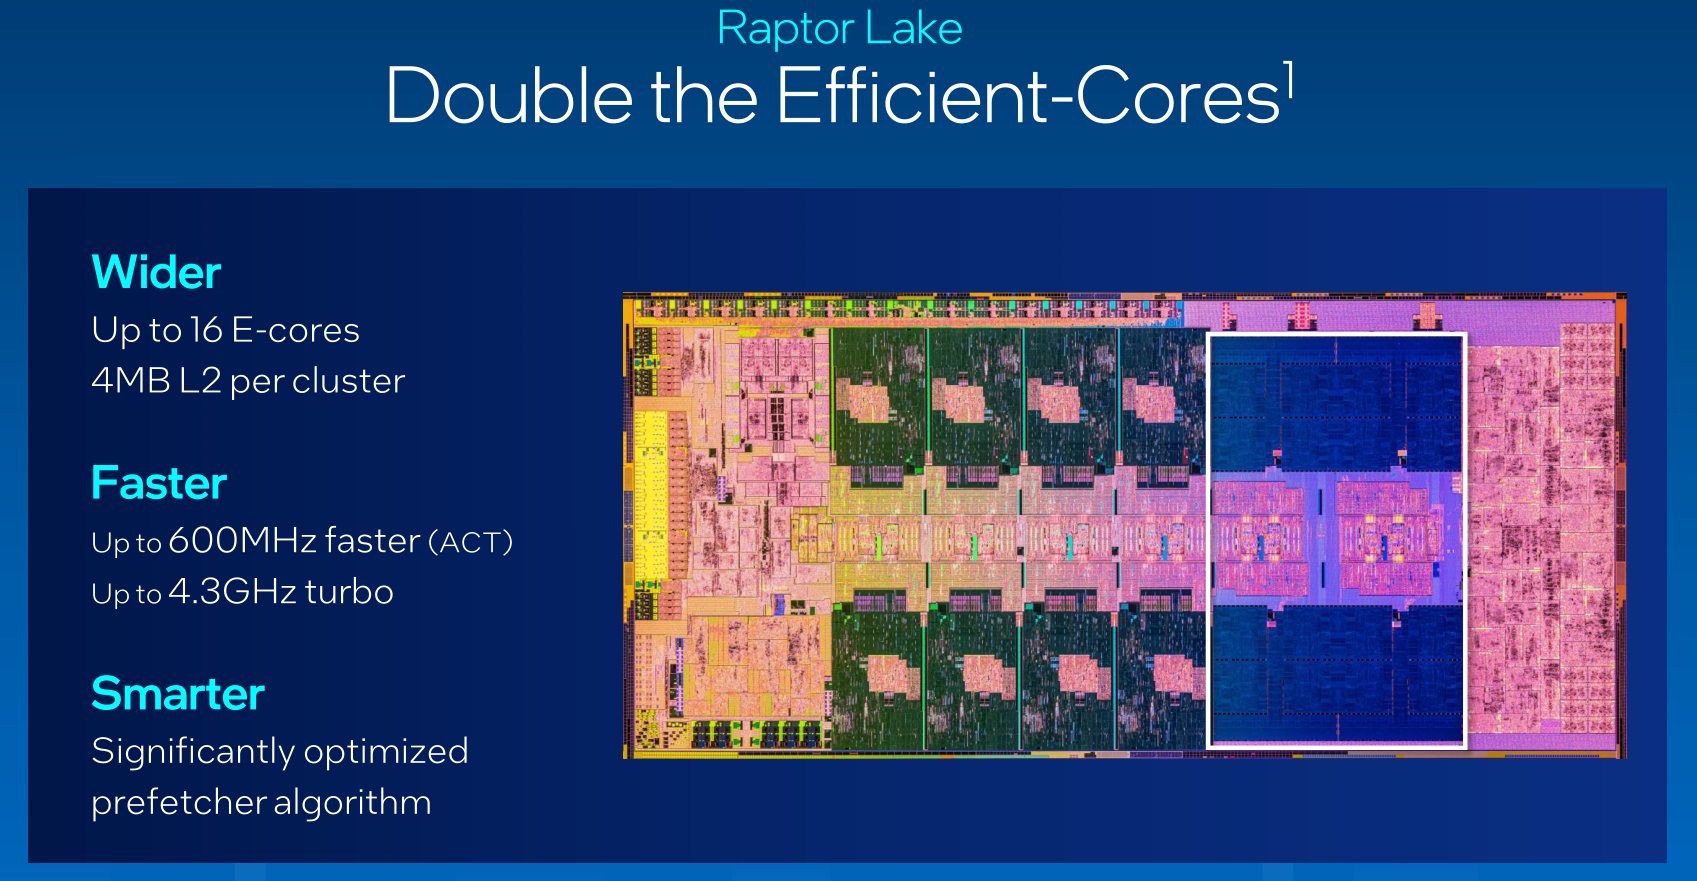
As we reviewed the previous generations of Intel Core i9-12900K processors, Intel has kept the same Gracemont-based Efficiency (E) core for Raptor Lake. The key difference when comparing the flagships of both generations, the Core i9-13900K has double the amount of E-cores compared to the previous generation. The doubling of E-cores in combination with the refined Raptor Cove core design for the P-cores means that the Core i9-13900K now has a total of 24-cores, with other SKUs benefitting from an increase in E-cores too.
Still, even with double the E-cores, the power penalty for doing this shouldn’t be an issue, at least not from a cooling perspective. As is with a high-performance processor and the high PL1/PL2 power it needs to stretch its legs, premium cooling would never go a miss. Intel isn’t officially recommending a minimum limit to cooling, but a low-performance cooler will almost guarantee thermal throttling as the Thermal Velocity Boost (TVB) for 13th Gen is set to 70°C.
In addition to the changes above, Intel’s 13th Gen Core series (unlike AMD’s Zen 4) offers support for both DDR5 and DDR4 memory. Further to the previous 12th Gen, the 13th Gen now supports faster DDR5 memory (DDR5-5600 versus DDR5-4800), an increase of 16.6%. Bandwidth and speeds for DDR4 memory remain at 3200 MT/s. Still, it allows users to match a lower-value processor without paying over the odds for DDR5 memory, which should decrease in price over time (hopefully).
Intel Thread Director: Windows 11 22H2 (or Newer) is Recommended
Since Intel’s 12th Gen Core series launch late last year, there was much furor around task scheduling in combination with Intel’s (new at the time) Thread Director built into the cores. While there were clear issues with Thread Director in combination with Windows 10, the Windows 11 operating system alleviated the issue of parking high single-threaded workloads on cores that otherwise wouldn’t be the best option (E-Cores). Although Windows 10 did in essence work with Intel Thread Director, it wasn’t really good at highlighting efficiency, and this is where Windows 11 came into play for optimal performance with Alder Lake.
Fast forward to now, and with all the additional E-cores in play with Raptor Lake, the latest update at the time of writing, Windows 11 22H2, offers the latest enhancements in the partnership between Intel, Microsoft, and the inner workings of Intel’s Thread Director. With a hybrid architecture and non-optimized software, it makes things a bit of a mess, but as per Intel’s guidance, they do recommend users use Windows 11 with 22H2 (or newer) for optimum performance when using 13th Gen Core series processors.
Over the next page is more information about the latest Z790 chipset which accompanies the Raptor Lake processors with this launch. From then on in, we'll detail our new CPU suite for 2023 and beyond, as well as see if Intel's 13th Gen Core Raptor Lake series can take a bite out of the competition. The associated pages and their contents are highlighted below:


169 Comments
View All Comments
Pjotr - Thursday, October 20, 2022 - link
Closing thoughts typos: Ryzen 580X3D and Ryzen 700. ReplyRyan Smith - Thursday, October 20, 2022 - link
Thanks! Replymode_13h - Thursday, October 20, 2022 - link
Thanks for the review!Could you please add the aggregates, in the SPEC 2017 scores? There's usually a summary chart that has an average of the individual benchmarks, and then it often has the equivalent scores from more CPUs/configurations than the individual test graphs contain. For example, see the Alder Lake review:
https://www.anandtech.com/show/17047/the-intel-12t... Reply
Arbie - Thursday, October 20, 2022 - link
TechSpot / Hardware Unboxed show that to complete a Blender job the 13900K takes 50% more total system energy than does the 7950X. Intel completing a Cinebench job takes 70% more energy. Meaning heat in the room. And that's with the Intel chip thermal throttling instantly on even the best cooling.Looking at AT's "Power" charts here, which list the Intel chip as "125W" and AMD as "170W", many readers will get EXACTLY THE OPPOSITE impression.
Sure, you mention the difficulties in comparing TDPs etc, and compare this gen Intel to last gen etc but none of that "un-obscures" the totally erroneous Intel vs AMD picture you've conveyed.
ESPECIALLY when your conclusion says they're "very close in performance" !! BAD JOB, AT. The worst I've seen here in a very long time. Incomprehensibly bad. Reply
gezafisch - Thursday, October 20, 2022 - link
Cope harder - watch Der8auer's video showing that the 13900k can beat any chip at efficiency with the right settings - https://youtu.be/H4Bm0Wr6OEQ ReplyRyan Smith - Thursday, October 20, 2022 - link
We go into the subject of power consumption at multiple points and with multiple graphs, including outlining the 13900K's high peak power consumption in the conclusion.https://images.anandtech.com/graphs/graph17601/130...
Otherwise, the only place you see 125W and 170W are in the specification tables. And those values are the official specifications for those chips. Reply
boeush - Thursday, October 20, 2022 - link
Not true. You have those insanely misleading "TDP" labels on every CPU in the legend of every performance comparison chart. This paints a very misleading picture of "competitive" performance, whereas performance at iso-power (e.g. normalized per watt, based on total system power consumption measured at the outlet) would be much more enlightening. Replyboeush - Thursday, October 20, 2022 - link
*per watt-hour (not per watt)[summed over the duration of the benchmark run] Reply
dgingeri - Thursday, October 20, 2022 - link
Is it just me, or does the L1 cache arrangement seem a bit odd? 48k data and 32k instruction for the P cores and 32k data and 64k instruction on the e-cores. Seems a bit odd to me. ReplyOtritus - Thursday, October 20, 2022 - link
Golden/Raptor Cove has a micro-op cache for instructions. 4096 micro-ops is about equal to 16Kb of instruction cache, which is effectively 48Kb-D + 48Kb-I. I don’t remember whether Gracemont has a micro-op cache. However, it doesn’t have hyperthreading, so maybe it just needs less data cache per core. Reply