Zotac ZBOX MAGNUS ONE SFF Gaming PC Review: Desktop Comet Lake Charges Up with Ampere
by Ganesh T S on August 13, 2021 10:00 AM ESTUL Benchmarks - PCMark and 3DMark
This section deals with a couple of UL Futuremark benchmarks - PCMark 10, and 3DMark. While PCMark evaluates the system as a whole, 3DMark focuses on the graphics capabilities with emphasis on gaming workloads.
PCMark 10
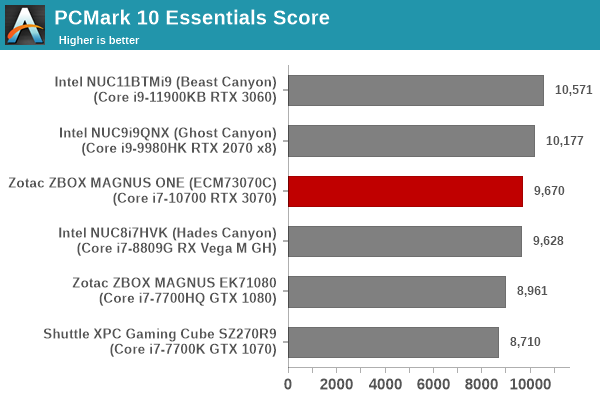
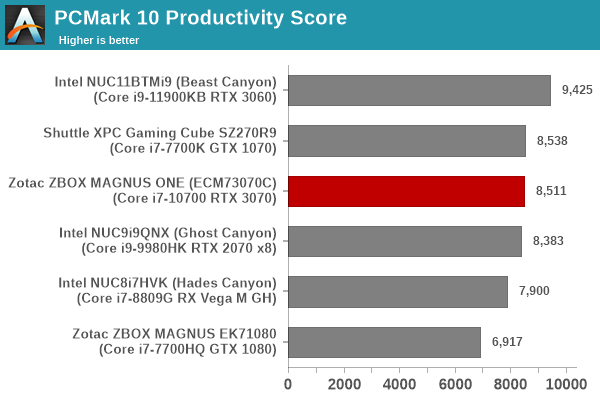
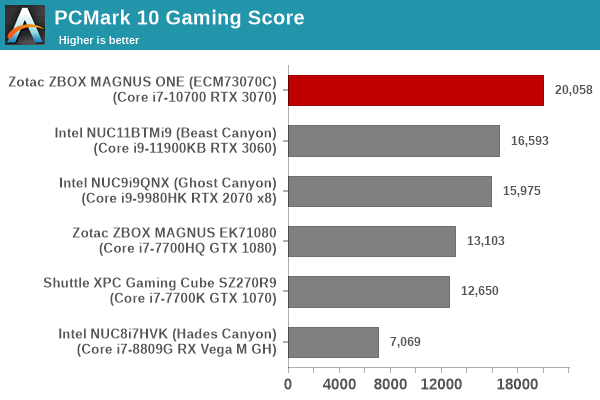
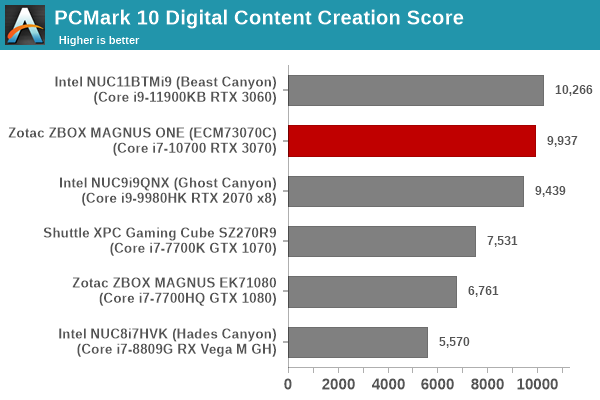
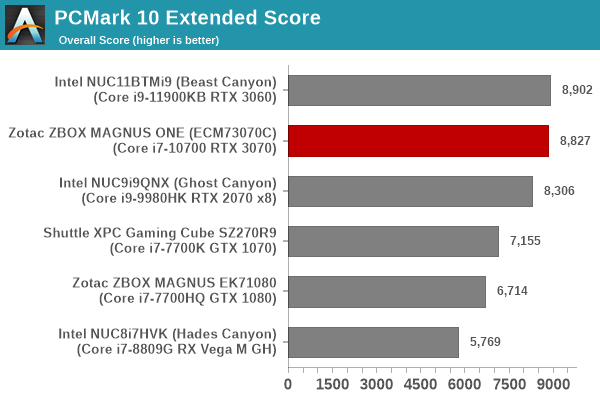
UL's PCMark 10 evaluates computing systems for various usage scenarios (generic / essential tasks such as web browsing and starting up applications, productivity tasks such as editing spreadsheets and documents, gaming, and digital content creation). We benchmarked select PCs with the PCMark 10 Extended profile and recorded the scores for various scenarios. These scores are heavily influenced by the CPU and GPU in the system, though the RAM and storage device also play a part. The power plan was set to Balanced for all the PCs while processing the PCMark 10 benchmark.
The top three slots in all the workloads are shared between the Beast Canyon NUC, the Ghost Canyon NUC, and the ZBOX MAGNUS ONE. The ZBOX comes out comfortably on top in the gaming section, but falls narrowly behind the NUCs in the others. This is nothing unexpected, given that the RTX 3070 is comfortably the highest-performing GPU we have evaluated in any mini-PC as yet.
3DMark
UL's 3DMark comes with a diverse set of graphics workloads that target different Direct3D feature levels. Correspondingly, the rendering resolutions are also different. We use 3DMark 2.4.4264 to get an idea of the graphics capabilities of the system. In this section, we take a look at the performance of the Zotac ZBOX MAGNUS ONE (ECM73070C) across the different 3DMark workloads.
3DMark Ice Storm
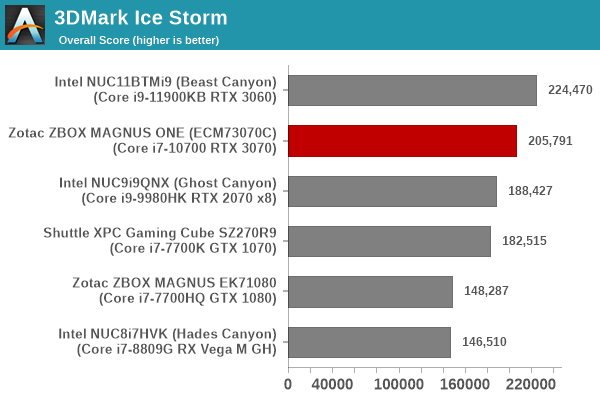
This workload has three levels of varying complexity - the vanilla Ice Storm, Ice Storm Unlimited, and Ice Storm Extreme. It is a cross-platform benchmark (which means that the scores can be compared across different tablets and smartphones as well). All three use DirectX 11 (feature level 9) / OpenGL ES 2.0. While the Extreme renders at 1920 x 1080, the other two render at 1280 x 720. The graphs below present the various Ice Storm worloads' numbers for different systems that we have evaluated. Rather than being GPU-bound, the Ice Storm benchmarks benefit greatly from a faster and more efficient CPU - Tiger Lake in the Beast Canyon in this case.
This benchmark sets the tone for what we will observe in many gaming workloads - at lower resolutions and quality settings, the Core i7-10700 in the MAGNUS ONE becomes a liability when compared to the Core i9-11900KB in the Beast Canyon NUC. With the CPU becoming the bottleneck, some of the RTX 3070 potential remains untapped.
| UL 3DMark - Ice Storm Workloads | |||
3DMark Cloud Gate
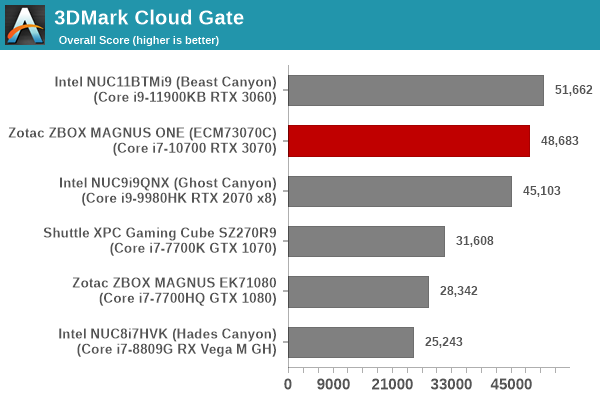
The Cloud Gate workload is meant for notebooks and typical home PCs, and uses DirectX 11 (feature level 10) to render frames at 1280 x 720. The graph below presents the overall score for the workload across all the systems that are being compared. At this low resolution, the score is impacted by the CPU rather than the GPU, and it is not much of a surprise to see the Beast Canyon coming out on top based on the analysis in the previous sub-section.
3DMark Fire Strike
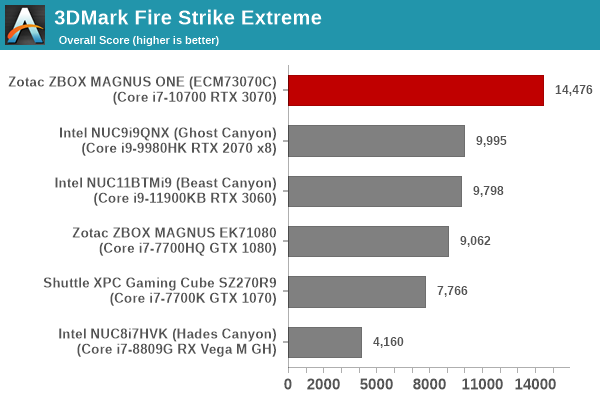
The Fire Strike benchmark has three workloads. The base version is meant for high-performance gaming PCs. Similar to Sky Diver, it uses DirectX 11 (feature level 11) to render frames at 1920 x 1080. The Extreme version targets 1440p gaming requirements, while the Ultra version targets 4K gaming system, and renders at 3840 x 2160. The graph below presents the overall score for the Fire Strike Extreme and Fire Strike Ultra benchmark across all the systems that are being compared. The 1080p+ resolutions and change in quality settings finally allow the GPU in the MAGNUS ONE to shine - the system comes out on top by a huge margin compared to the other PCs in the fray.
| UL 3DMark - Fire Strike Workloads | |||
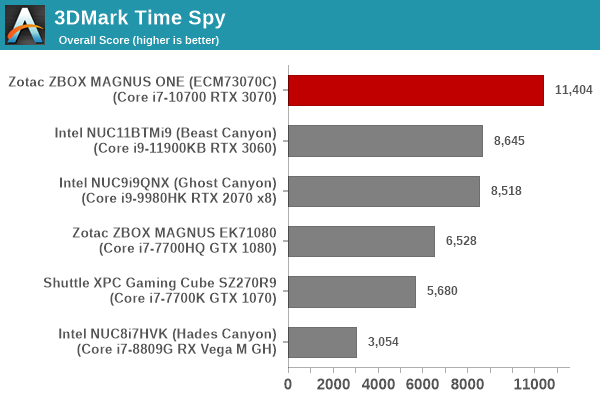
3DMark Time Spy
The Time Spy workload has two levels with different complexities. Both use DirectX 12 (feature level 11). However, the plain version targets high-performance gaming PCs with a 2560 x 1440 render resolution, while the Extreme version renders at 3840 x 2160 resolution. The graphs below present both numbers for all the systems that are being compared in this review. We again see the 1440p and 4K resolutions allowing the MAGNUS ONE to stand out, and that is no surprise given the analysis in the previous sub-sections.
| UL 3DMark - Time Spy Workloads | |||
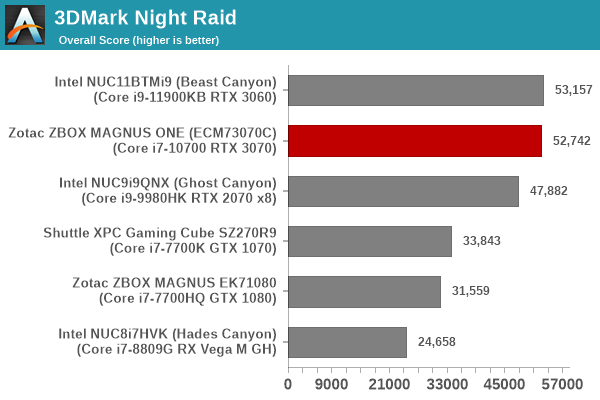
3DMark Night Raid
The Night Raid workload is a DirectX 12 benchmark test. It is less demanding than Time Spy, and is optimized for integrated graphics. The graph below presents the overall score in this workload for different system configurations. An iGPU-focused benchmark means that workload is likely to be geared towards lower resolutions and quality settings. The CPU of the MAGNUS ONE becomes the bottleneck, and the RTX 3070's potential is not fully seen. That said, the system does manage to be in the same league as that of the Beast Canyon and far ahead of others in the fray.
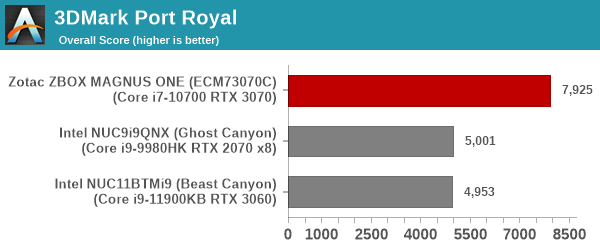
3DMark Port Royal
UL introduced the Port Royal ray-tracing benchmark as a DLC for 3DMark in early 2019. The scores serve as an indicator of how the system handles ray-tracing effects in real-time. As expected, the RTX 3070 with its higher TDP is better off compared to the RTX 3060, allowing the MAGNUS ONE to outscore the Beast and Ghost Canyons by a significant margin.
3DMark CPU Profile Benchmark
UL recently introduced a benchmark to test the multi-threaded capabilities of the CPU in a system. Since gaming workloads are often multi-threaded, it makes sense to include this testing as part of the 3DMark suite. The benchmark routine attempts to perform the simulation of birds / bird-like objects flocking together using as many advanced capabilities as offered by the processor. The workload is configured to run with different number of threads ranging from 1 to 16 (and a single entry for the maximum number of threads allowed in the system).
| UL 3DMark - CPU Profile Benchmark | |||
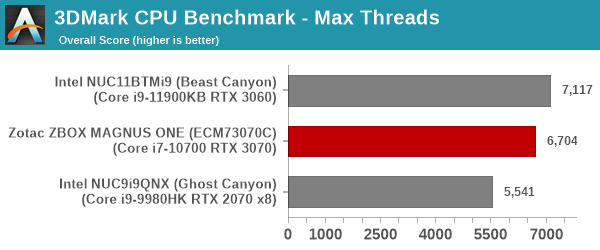
We present the benchmark results for the single and maximum threads case above. Despite the same TDP and similar thread counts, the advanced Tiger Lake microarchitecture allows the Beast Canyon NUC to score better than the MAGNUS ONE. The Ghost Canyon's CPU has a 45W TDP and the 20W delta puts the system at a disadvantage over the MAGNUS ONE and the Beast Canyon.


19 Comments
View All Comments
Samus - Sunday, August 15, 2021 - link
I'm surprised nobody has pointed out the obvious here: this thing looks better than a PS5\XBOXX while actually being smaller and more powerful. Sure it costs more but it isn't like you can actually but a PS5 or XBOXX for MSRP anyway...lemurbutton - Sunday, August 15, 2021 - link
Most people do get the PS5/XSX at MSRP. This thing is 4.8x more expensive.Threska - Sunday, August 15, 2021 - link
More closely resembles a fat Motorola Cable Modem.Spunjji - Monday, August 16, 2021 - link
"looks better than"Hmmm, I'd argue it's about the same at best? YMMV
"more powerful"
Certainly, but -
"it costs more"
As lemurbutton pointed out, it costs 4.8x more - and it's not 4.8x more powerful.
To me the comparison looks pretty favourable to the console, unless you have a specific need for a PC.
Oxford Guy - Sunday, August 15, 2021 - link
‘Overall, the system has an effective thermal solution, but that comes at the cost of fan noise. For a gaming mini-PC with a 220W TDP GPU, that is to be expected.’I see buttons for Temperatures and Power but no data about decibels (noise pollution), such as decibels-per-watt, peak noise, etc.
Since fan noise is to be expected, one would expect to be able to know how much there is of it, in order to decide if it’s worth having in order to obtain the often dubious benefit of a somewhat smaller case.
Also, does the slow RAM (in terms of the latency being 22) operate in single channel mode?
twotwotwo - Sunday, August 15, 2021 - link
With apologies for some shameless brand cheerleading, I'd love to see a similar "essentially prebuilt" SFF Ryzen option with dGPU; even a weak or past-gen dGPU could fit the non-APU chips into a smaller form factor. Retail-available APUs no longer lag the CPUs as much as they did between the Matisse launch and the 5x00G release, so maybe the difference is less dramatic now, but it's still a seemingly unfilled niche.easp - Monday, August 16, 2021 - link
I keep thinking this is a Motorola cable modem, circa 2014, when I see the hero picture for the article.aj654987 - Thursday, August 19, 2021 - link
I normally dont care much about looks of cases but for $2400 it should look cooler than this. This looks like those giant router/modem combo boxes the ISPs use, its ugly.noident - Tuesday, August 31, 2021 - link
Got this one as a barebone (1420 EUR Magnus One, + 70 EUR for 16 Gigs and 130 EUR for 1TB Samsung M2) This PC really performs as expected. The best thing is I just can put it on the desk so the child will not fiddle with any funny lights (very decent design with that glowing ring).The downside is the noise though. Since I'm playing with headphones it doesn't really bother me but taking off the headphones during gaming is like realizing you just disembarked from an airplane. Zotac should do something about the CPU and PSU fan.